A+
Investment Rating
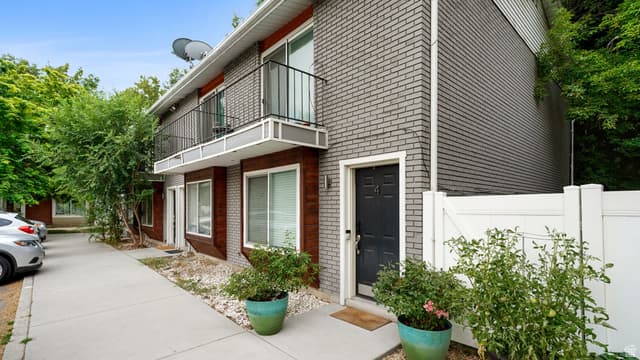
1488 S 400 E ##1-4
Salt Lake City, UT 84115
$1,150,000
Highlights
Year 1
Pays for Itself
$285k
Cash to Close
$67k
Cash Flow Yr 10
$1M
Equity Yr 10
$393k
Tax Savings (10yr)
Performance Metrics
8.5%
Gross Yield
7.3%
Cap Rate
4.2%
Cash on Cash
20.9%
5-Year IRR
20.7%
10-Year IRR
Projections
Cash Flow
Equity
Cash Flow Details
Deal Summary
4.3% below market · Income approach at 3.81% cap rate
| Year | Home Value | Loan Bal | Equity | Cash Flow | Cumulative | IRR |
|---|---|---|---|---|---|---|
| 1 | $1M | $797k | $331k | $20k | $20k | -0.5% |
| 5 | $1M | $751k | $614k | $38k | $144k | 20.9% |
| 10 | $2M | $677k | $1M | $67k | $418k | 20.7% |
| 15 | $2M | $576k | $2M | $104k | $860k | 19.9% |
| 20 | $3M | $439k | $2M | $151k | $2M | 19.3% |
| 25 | $4M | $253k | $3M | $213k | $2M | 18.9% |
| 30 | $5M | $0 | $5M | $291k | $4M | 18.7% |
Adjusted assumptions:
IMPORTANT DISCLAIMER: Any calculations or estimates provided regarding potential return on investment in real estate are not guaranteed, and are subject to change based on various factors, such as fluctuations in the market, property value growth in the region, changes in rental income, taxes, maintenance costs, potential renovations, regulatory changes, shifts in supply and demand, and other variables. Past performance does not guarantee future results.