Triplex52d on market
A
Investment Rating
CF: B+Ret: A+
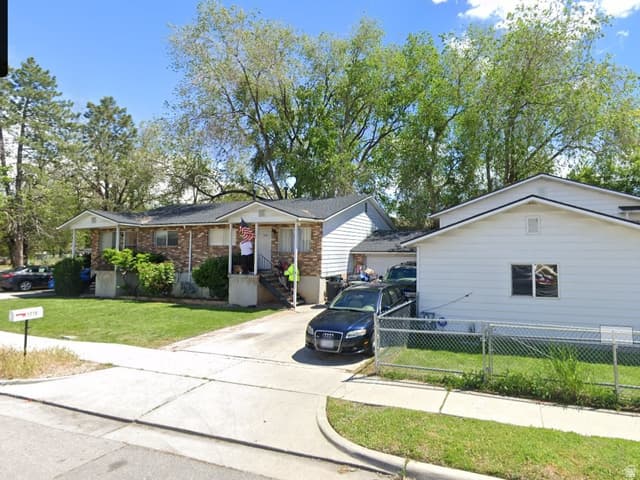
1711 W 400 N
Salt Lake City, UT 84116
$875,000
Highlights
Year 1
Pays for Itself
$232k
Cash to Close
$36k
Cash Flow Yr 10
$882k
Equity Yr 10
$312k
Tax Savings (10yr)
Performance Metrics
8.4%
Gross Yield
7.3%
Cap Rate
3.8%
Cash on Cash
20.4%
5-Year IRR
19.4%
10-Year IRR
Projections
Cash Flow
Equity
Cash Flow Details
Gross Revenue (Rent)
Net Operating Income
$5,327
Take-Home (before reserves)
$1,340
True Cash Flow
$728
Deal Summary
Offer Price
$132/sqft
$
Down Payment
$218,750 (25.0%)
Closing Costs~2% of loan amount
$
Renovation Cost
$
Other Expenses (monthly)
$
| Year | Home Value | Loan Bal | Equity | Cash Flow | Cumulative | IRR |
|---|---|---|---|---|---|---|
| 1 | $919k | $648k | $271k | $16k | $16k | 0.0% |
| 5 | $1M | $612k | $508k | $24k | $101k | 20.4% |
| 10 | $1M | $551k | $882k | $36k | $257k | 19.4% |
| 15 | $2M | $469k | $1M | $50k | $478k | 18.1% |
| 20 | $2M | $357k | $2M | $66k | $773k | 17.1% |
| 25 | $3M | $206k | $3M | $84k | $1M | 16.3% |
| 30 | $4M | $0 | $4M | $106k | $2M | 15.8% |
Loading neighborhood data...
IMPORTANT DISCLAIMER: Any calculations or estimates provided regarding potential return on investment in real estate are not guaranteed, and are subject to change based on various factors, such as fluctuations in the market, property value growth in the region, changes in rental income, taxes, maintenance costs, potential renovations, regulatory changes, shifts in supply and demand, and other variables. Past performance does not guarantee future results.